
We could not find any results for:
Make sure your spelling is correct or try broadening your search.
The sideways price action of a reversal pattern signifies that upon breaking out of the pattern there will be a turnaround in the current trend.
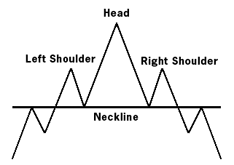
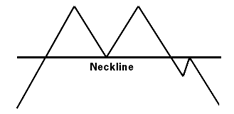
The Head and Shoulders pattern is one of the most classic patterns in a technical analyst’s toolkit.
This three-peak formation is named for its resemblance to a head and two shoulders. The center peak (head) protrudes above the remaining two peaks (shoulders), which are set at or close to identical levels. The common line of support for all three peaks, which does not have to be a horizontal line, is known as the Neckline. The final downward penetration of the neckline confirms the start of a new downward trend.
There is a chance that even after there is a break of the neckline that the trend may not reverse. A good validation of a reversal would be if the break is significant or if the neckline is tested and it turns from support to resistance. Also, a trader should look and see if momentum was higher during the formation of the left shoulder compared to the right shoulder as this would indicate that buying pressure is decreasing and a true reversal pattern is taking place. During a true head and shoulders reversal, the downward move can be expected to be equal to the distance from neckline to head.
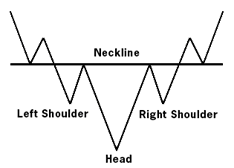
The inverse Head and Shoulder pattern follows the same model.
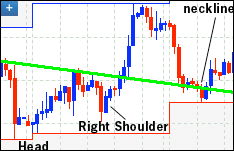
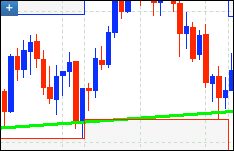
In this chart you can see that at first price is heading downwards. After the pattern forms, price reverses and there is a substantial move in an upward direction. Soon though price retracts and tests the neckline. The neckline holds as support, and the uptrend continues, completing the reversal. You can also see, from the momentum indicator, that selling pressure eases by the time the right shoulder is forming.
A double top is formed when the price of a pair in an uptrend rises and encounters resistance. Following this, price retreats to a support level which will become the neckline and subsequently returns to the resistance level. After failing to break the resistance level a second time the pair falls back down. At the neckline price breaks down into a new downward trend.
The same but opposite scenario occurs in the case of a double bottom. A downtrend reverses after testing a certain support level twice. Failing to breakthrough, price reverses into a new uptrend. Sometimes, the pair will retest the neckline, which should switch its role from support to resistance.
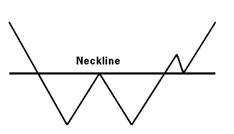
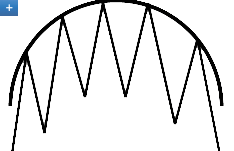
In the typical triple top formation each one of the heads is about the same size. A line of resistance can be drawn connecting the three tops. A neckline should be drawn connecting the support levels. After the third head, price falls below the neckline. The market may rebound for a short attempt at breaking back past the neckline only to be followed by the start of a new downward trend.
Notice that the neckline is slanted upwards instead of perfectly horizontal, which is normal. For all of these patterns, a trader will be hard pressed to find them exactly as they are shown in their theoretical forms.
Another variation of the shape a top and bottom can take is one in which the reversal is ‘rounded’. The rounded top formation forms when the market gradually yet steadily shifts from a bullish to bearish outlook while in the case of a rounded bottom, from bearish to bullish. The prices take on a bowl shaped pattern as the market slowly and casually changes from an upward to a downward trend.
Continuation patterns indicate that the price action described by the pattern is merely a pause in the prevailing trend and that upon breaking out of the pattern the price trend will continue in the same direction. There are several patterns that imply trend reversals: Flags, Rectangles, Triangles, and Wedges.
Of course, patterns do not result in a continuation of the prevailing trend all the time and analytical skill is needed to gauge whether they will come to fruition.
Flags are a type of short-term pause in the dynamic and progressive movement of a market trend. Flags are usually marked by a sharp, almost horizontal entry into the pattern. Flags are bound by parallel lines of support and resistance. The pattern is commonly followed by a sharp break back into the prevailing trend.
Flags have a tendency to form slanted in the direction opposite to the major market trend they inhabit.
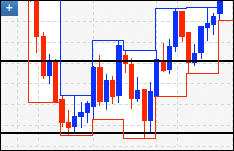
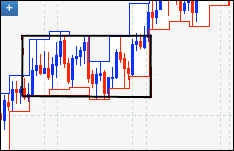
A Rectangle is a period of consolidation within an existing trend where the price moves sideways, fluctuating between two horizontal lines before finally resuming its previous trended course. Such a pattern is not very significant to the trend’s future course – a rectangle seldom accelerates the prevailing trend beyond its previous slope. Though not characteristic in determining any anomalous effects in the presiding trend, a rectangle pattern presents an opportunity to trade within, as one can open alternating positions as the price repeatedly bounces from support to resistance and back.
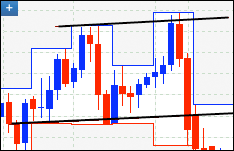
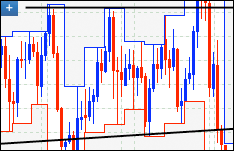
A real world example is presented below. An uptrend that was started in September enters a period of consolidation in October. Price forms a rectangle pattern before the uptrend continues. You can see a flag pattern emerge a couple of months later as well.
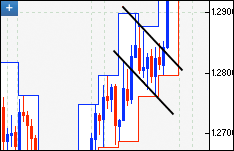
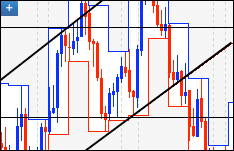
A symmetrical triangle is indicative of a period of consolidation during an uptrend or a downtrend. The symmetrical triangle has a line of support that slopes upwards and a line of resistance that slopes downward. The triangle pattern yields to a breakout in the direction that corresponds with the trend beforehand, though not always.
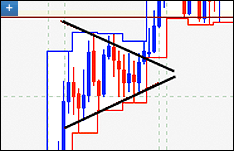
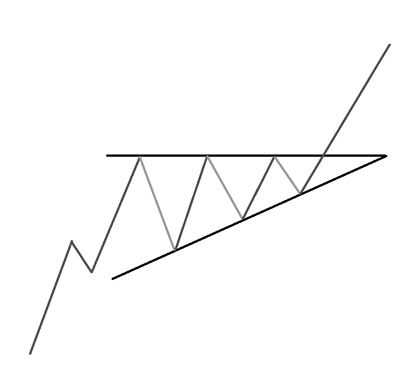
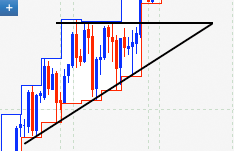
An ascending triangle is indicative of a period of consolidation during an uptrend. It is formed when price action moves between a line of resistance that is relatively flat or horizontal and a line of support that is sloping upwards.
As the two lines converge the chance of a break out increases. When price moves strongly above the line of resistance the pattern ends.
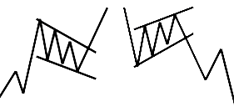
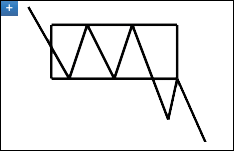
The wedge pattern shares most of its characteristics with the symmetrical triangle and the flag. The wedge forms much like the triangle and signifies a sharp expected breakout in the direction of the prevailing trend. Much like the flag, however, the wedge itself forms at an inclination opposite to the direction of the trend before breaking out in the direction of the prevailing trend.
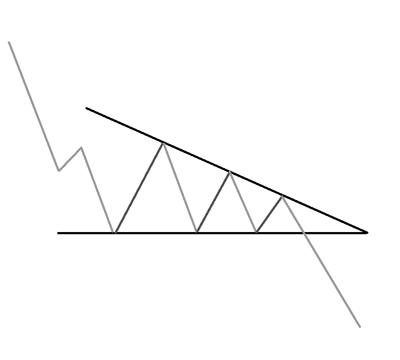
A descending triangle is indicative of a period of consolidation during a down trend. It is formed when price action moves between a line of resistance that is sloping downwards and a line of support that is relatively flat or horizontal. As the two lines converge the chance of a break out increases. When price moves strongly below the line of support the pattern ends and the downtrend continues.
The wedge pattern shares most of its characteristics with the symmetrical triangle and the flag. The wedge forms much like the triangle and signifies a sharp expected breakout in the direction of the prevailing trend. Much like the flag, however, the wedge itself forms at an inclination opposite to the direction of the trend before breaking out in the direction of the prevailing trend.

Support: 1-888-992-3836 | support@advfn.com
By accessing the services available at ADVFN you are agreeing to be bound by ADVFN's Terms & Conditions

 Hot Features