
We could not find any results for:
Make sure your spelling is correct or try broadening your search.
In order to clearly see trends a technical analyst must draw trendlines and identify levels of support and resistance.
Trends do not move in straight lines; they zigzag in a general direction forming progressively higher (or lower) peaks and lows.
At a price peak, or high, buyers that are pushing up the price of an asset such as a currency pair hit resistance. There are many sellers at that particular price, and they overpower the buyers (who may turn into sellers themselves). The price will dip as long as this selling pressure is present. If the uptrend is significant however, as the price dips buyers that missed the opportunity to buy (or have sold at the peak), will now buy the pair and the price will recover until there is a next peak. These peaks within a trend are known as the trend’s resistance levels.
At a price trough, or low, the opposite is happening. An asset that is falling in value will meet some support. It is the price at which sellers are overpowered by an influx of buyers. These lows within a trend are known as support levels.
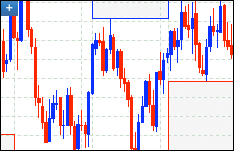
Here is an example of support and resistance levels in a sideways moving trend:
A trendline is a straight line connecting significant support or resistance levels. Generally, a trendline can be drawn from as few as two support/resistance levels. However, the more support/resistance levels that are touching the trendline, the more stable the trend is.
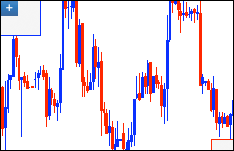
Trendline penetrations, also known as violations or breaks, are key technical signals in determining the market’s future direction. They can mean that an existing trend is ready to reverse or change its characteristics.
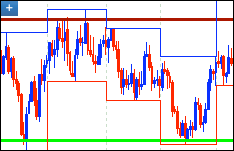
Upon penetrating a firm line of resistance, the market often chooses to take up that very line of resistance as its new line of support. In the figure below, there is a trendline break in November. When price recedes from its new high near 1.3400 it bounces off support at the line that had previously been resistance.
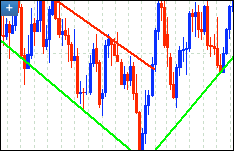
The reverse is also true, as lines of resistance often replace previous lines of support in cases of downward penetration. In this example the trendline is upward sloping, not sideways. There is a downward trendline break in October. The old trendline, which had acted as support now turns into resistance, first right away and then again three months later.
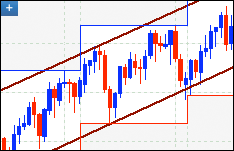
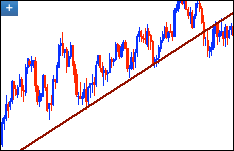
The channel line runs parallel to the basic trendline, joining the support levels in an upward trend and the resistance levels in a downward trend. If the price of the currency pair continuously oscillates between the trendline and the channel line then one can assume that a valid channel exists.
The channel is one of the most useful analytical patterns. Unlike the breaking of a trendline, which signifies a possible reversal in the trend, the penetration of the channel line is a common indicator of expected acceleration of the already prevalent trend. A failure to reach the channel line on the other hand is an indication that the trend is failing and that price may break through the trend line on its next turn.

Support: 1-888-992-3836 | support@advfn.com
By accessing the services available at ADVFN you are agreeing to be bound by ADVFN's Terms & Conditions

 Hot Features