HP Inc. Down Nearly 10%, on Pace for Lowest Close Since February 2017 -- Data Talk
October 04 2019 - 12:41PM
Dow Jones News
HP Inc. (HPQ) is currently at $16.60, down $1.80 or 9.76%
-- Would be lowest close since Feb. 22, 2017, when it closed at
$16.20
-- On pace for largest percent decrease since Feb. 28, 2019,
when it fell 17.27%
-- Earlier Friday, four firms cut their price target for HP
Inc., Benzinga reported
--On Thursday, the company announced a restructuring that could
eliminate 7,000 to 9,000 jobs from its roughly 55,000 workforce
over the next three years. The cuts, once completed, should yield
annual savings of about $1 billion, the company said at its annual
securities-analyst meeting
--On Thursday, company officials said they expect to deliver
$1.98 to $2.10 a share for the year that ends Oct. 31, 2020, below
the $2.18 analysts surveyed by FactSet were forecasting. On an
adjusted basis, which would strip out the restructuring costs and
other items, company officials projected a profit of $2.22 to $2.32
a share, compared with analysts' projected $2.24 a share
-- Currently down three of the past four days
-- Currently down two consecutive days; down 10.68% over this
period
-- Worst two day stretch since the two days ending March 1,
2019, when it fell 17.82%
-- Down 18.84% year-to-date; on pace for worst year since 2015,
when it fell 35.01%
-- Down 45.77% from its all-time closing high of $30.62 on July
13, 2000
-- Down 34.47% from 52 weeks ago (Oct. 5, 2018), when it closed
at $25.34
-- Down 34.88% from its 52-week closing high of $25.50 on Nov.
8, 2018
-- Would be a new 52-week closing low
-- Traded as low as $16.46; lowest intraday level since Feb. 22,
2017, when it hit $16.09
-- Down 10.54% at today's intraday low; largest intraday percent
decrease since Feb. 28, 2019, when it fell as much as 18.91%
-- Worst performer in the S&P 500 today
-- Second most active stock in the S&P 500 today
All data as of 11:57:27 AM
Source: Dow Jones Market Data, FactSet
(END) Dow Jones Newswires
October 04, 2019 12:26 ET (16:26 GMT)
Copyright (c) 2019 Dow Jones & Company, Inc.
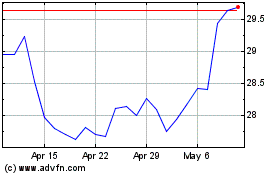
HP (NYSE:HPQ)
Historical Stock Chart
From Apr 2024 to May 2024

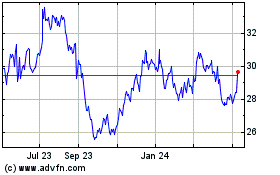
HP (NYSE:HPQ)
Historical Stock Chart
From May 2023 to May 2024
