Investors Hold Fire Ahead of Fed Minutes
October 09 2019 - 5:09AM
Dow Jones News
By Anna Isaac
-- Brent crude falls
-- Gold prices rise
-- Asian markets mixed
Global stocks were mixed as investors awaited the resumption of
U.S.-China trade talks and looked for fresh signals from the
Federal Reserve on monetary easing.
Japan's benchmark Nikkei 225 index slipped 0.6% as data on
machine-tool orders confirmed a bleak picture for the country's
manufacturing sector.
The "numbers remain abysmal," analysts at Pantheon
Macroeconomics said in a note. "The absence of any hints of a
sustainable recovery suggests that industrial production in Japan,
and output globally, looks set to stay subdued in year-on-year
terms," they said.
Hong Kong's Hang Seng dropped 0.8% amid tensions over protests
in the city. The Shanghai Composite gauge climbed 0.4%.
In Europe, the Stoxx Europe 600 edged up 0.2%, led by equities
in Germany. The U.K.'s FTSE 100 index ticked up 0.3%, a day after
the pound weakened and made British assets appear more
attractive.
Sterling, which fell Tuesday after U.K. leaders clashed with
their European counterparts over Brexit, edged up 0.1% against the
U.S. dollar.
Investors moved toward haven assets such as gold. The precious
metal rose 0.6% Wednesday and remained above $1,500 a troy ounce, a
level it broke through for the first time in six years in August.
It is up around 17% this year.
Later Wednesday, investors are likely to listen closely to any
fresh signals from Federal Reserve Chairman Jerome Powell in a
speech in Kansas City. The Fed will increase its purchases of
short-term securities soon in an effort to avoid stress in lending
markets, Mr. Powell said Tuesday.
The U.S. central bank will later Wednesday release the minutes
from its September meeting, which will likely be scrutinized
closely for any insight into the interest-rate outlook.
In commodities, the benchmark for global oil, Brent crude, fell
0.2% to $58.11 a barrel.
Write to Anna Isaac at anna.isaac@wsj.com
(END) Dow Jones Newswires
October 09, 2019 04:54 ET (08:54 GMT)
Copyright (c) 2019 Dow Jones & Company, Inc.
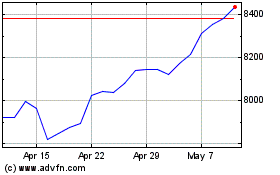
FTSE 100
Index Chart
From Mar 2024 to Apr 2024

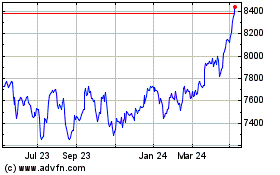
FTSE 100
Index Chart
From Apr 2023 to Apr 2024
